- The data for this example can be found here.
- The screencast will show you how to make this basic scatterplot type; the step-by-step directions below the screencast should also help.
click here for full video explaining these scatterplots and more
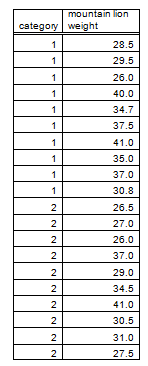
Table 1. Correct format for data for creating a scatterplot to go with a t-Test (categories will appear along the x-axis).
-
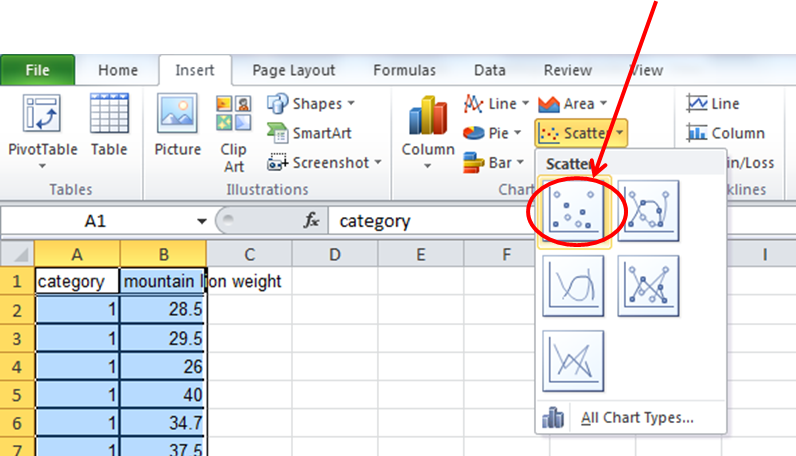
Once your data are entered like those shown in the table above, click and highlight your column headings and all of your data, then click the Insert tab, choose the Chart type Scatter, and click on the Chart with data points but no lines.
-
You should then see a graph that looks similar to this:
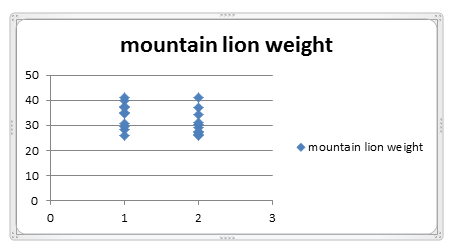
- Once you see a graph like the one shown above, you're very close! Now you just need to adjust the formatting. Here you can find directions that should be helpful for adjusting the formatting of many styles of graphs generated by MS Excel.